News & Media
And the rich get richer…
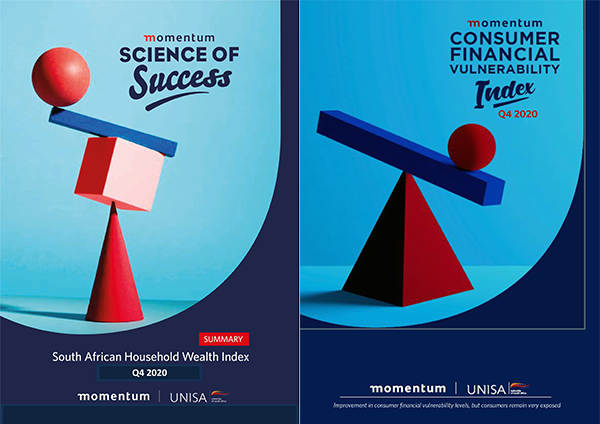
 The real net wealth of South African households increased by just more than R1 trillion from the second quarter of 2020 to the end of the year. This is a key finding in the latest Momentum-Unisa Household Wealth report, which shows that household wealth recovered after an estimated decline of R772.8 billion during the first quarter of 2020 that resulted from the introduction of lockdowns to limit the spread of Covid-19 in many countries, including South Africa.
The authors of the report, Momentum researcher and economist Johann van Tonder and Professor Carel van Aardt and Jacolize Meiring from Unisa’s Bureau of Market Research, say this happened despite Covid-19, the lockdown, job losses, and an economic contraction.
At the same time, the latest release of the Momentum/Unisa Consumer Financial Vulnerability Index indicates that while some of the financial strain that several consumers had to endure during the initial lockdown periods early in 2020 dissipated during the fourth quarter of 2020, the improvement follows two very difficult quarters during which the index deteriorated to the highest level of financial vulnerability since inception in 2009.
Authors Van Tonder, Van Aardt, Meiring, and Momentum’s Itumeleng Olien highlight that consumers suffered greatly during 2020. The average annual score indicates that consumer financial vulnerability was at its lowest level since inception of the index, dropping to a low of 43.4 points. The main contributor to the low score was a significant increase in debt servicing vulnerability.
So why are some households more robust than others? As Meiring points out, net wealth relates to the actuals of those households that do have assets and liabilities. “It is estimated that only 2% of all households in South Africa own almost half of all wealth (assets minus liabilities), so only those with investments (especially in financial assets, such as shares) could share in the growth, unfortunately,” she says. In contrast, the bottom 16% had negative net wealth values where their outstanding debts exceeded the value of their assets.
These numbers should, however, be interpreted with caution. For instance, the wealthiest 2% are not necessarily the top 2% income earners. Many middle-income earning households formed part of the wealthiest 2% of households as they, among others, saved, invested, and insured in the right way, whilst not borrowing beyond their affordability thresholds. Contrastingly, some high-income earners had a negative net wealth position as they used their income sub-optimally from a wealth creation point of view.
*Compiled by Sharon Farrell, Editor, Department of Institutional Advancement
Publish date: 2021-02-25 00:00:00.0

 Community champion and agricultural entrepreneur extraordinaire honoured by Unisa
 Ghanaian-born Swede earns PhD in Information Sciences from Unisa
 Unisa awards honorary doctorate to exemplary philanthropist and entrepreneur Collen Tshifhiwa Mashawana
 Inhlanyelo Hub explores financing and sustainability at the International Conference on Business Incubation
 Unisa remains anchored among the waves